- The Morning Grind
- Posts
- New report reveals the numbers behind who's winning in dental
New report reveals the numbers behind who's winning in dental
INDUSTRY
New report reveals the numbers behind who's winning in dental
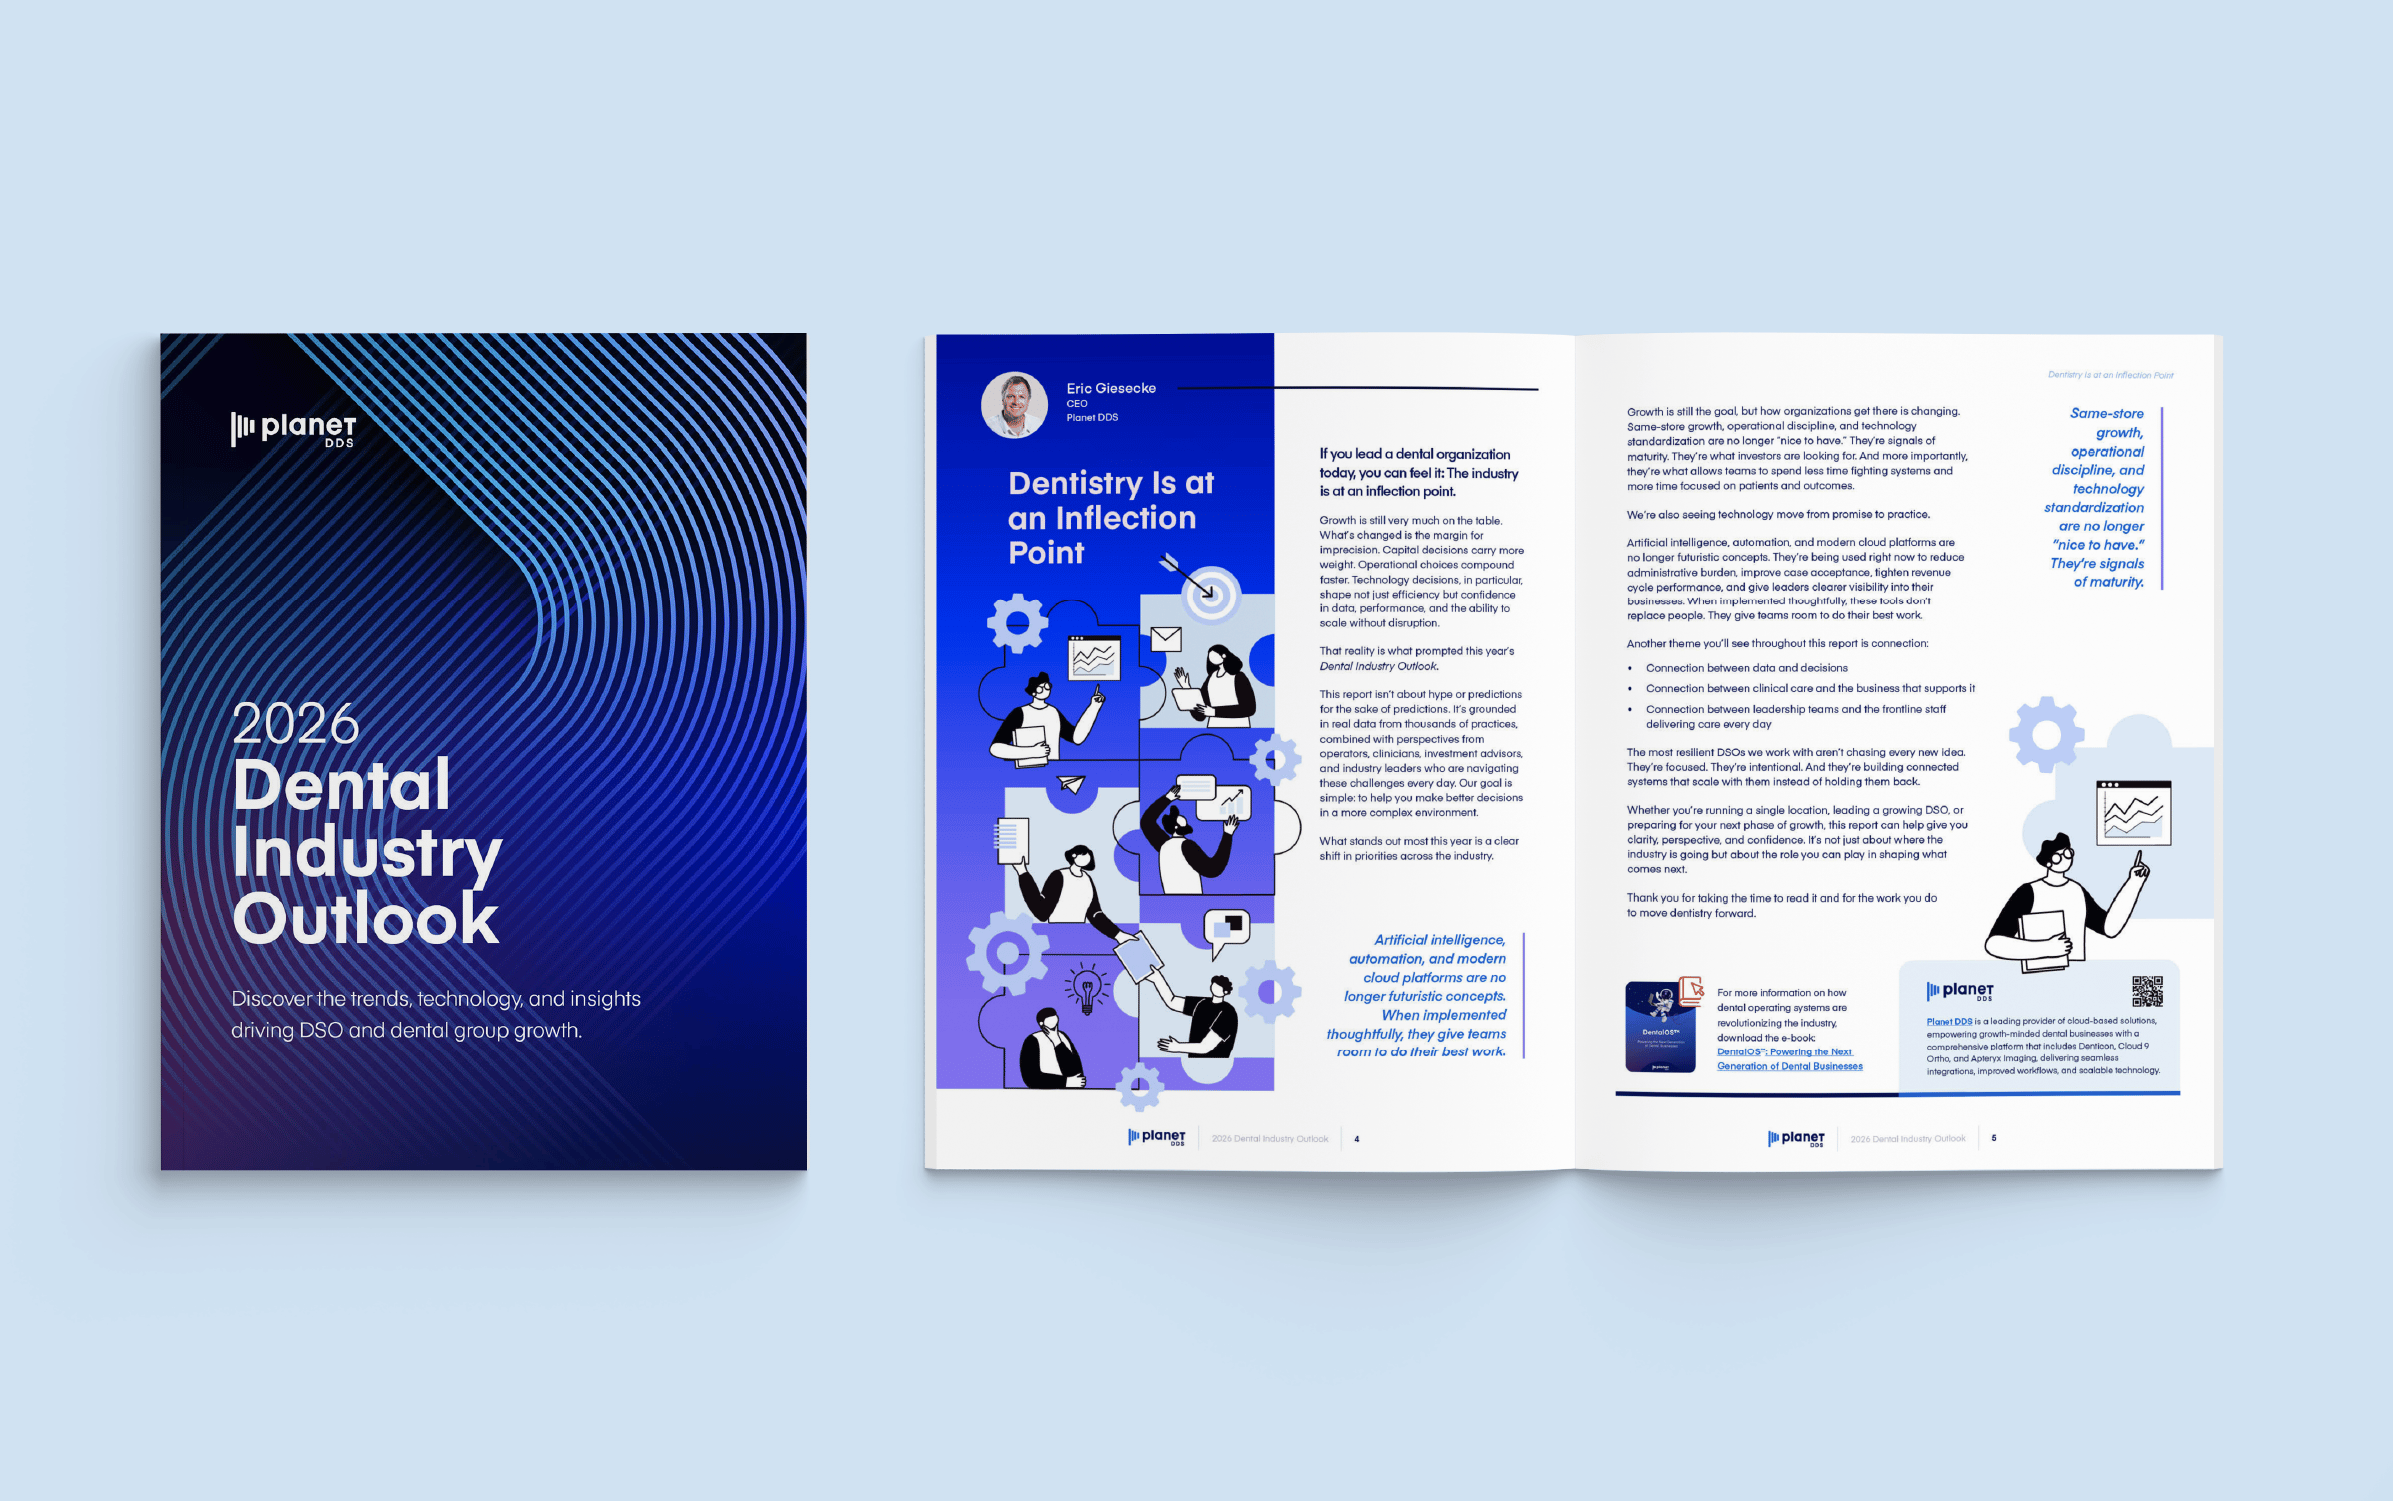
A new report analyzing more than 8,000 dental practices shows the most successful quickly pulling away from the competition.
What happened: The Planet DDS 2026 Dental Industry Outlook report found that, across roughly 3,300 practices with year-over-year comparisons, weighted average same-store production growth came in at 4.0%. The simple average—which treats every practice equally regardless of size—was 6.6%.
Dig deeper: The data also shows that growth was not equally distributed. A full third of practices (33.5%) grew by more than 10%, while nearly 14% declined by more than 10%. That spread between top and bottom performers is enormous.
The numbers paint a picture of an industry where high performing practices that master same-store growth and use technology to drive efficient operations are quickly pulling ahead.
The operational benchmarks: Curious how you stack up? The report offers a useful set of benchmarks for DSO leaders looking to see how their practices compare.
Case acceptance: 58% average, up from 57% in 2024
Case completion: 47%, up from 42%—a meaningful jump, though still meaning more than half of accepted treatment plans go unfinished
Cancellation rate: 12.9%, down from 15.5%
No-show rate: 6.9%, down from 7.4%
New patients: 46 per month per practice (including specialty), up from 43
Hygiene reappointment: 63%, up from 60%
Average daily production: $8,764 per practice
Yes, but: Those benchmarks are averages. The picture is dramatically different when you compare top performing practices to the lower end of the pack.
Case acceptance varies wildly across practices—nearly 10% of practices sit below 30%, while another 9% convert above 90%.
New patient volume is similarly lopsided: Almost 39% of practices see fewer than 20 new patients per month, while nearly 18% see 80 or more. That's a 4x gap in the single metric most closely tied to growth.
Why it matters: The broader industry context makes these numbers more urgent. DSO deal volume has fallen sharply, from more than 30 sales and recapitalizations in 2021–2022 to fewer than 12 from 2023–2025, according to DC Advisory's Rich Blann. Investors are now zeroing in on DSOs with efficiently run, integrated platforms and a track record of strong growth.
Bottom line: The 2026 outlook paints a picture of an industry where the organizations pulling ahead are the ones nailing the basics of getting more new patients in the door, keeping the schedule full, converting accepted treatment into completed production, and collecting what they're owed.
If you enjoyed this article, you should sign up for the Morning Grind, the fast and free bi-weekly newsletter that keeps DSO leaders in the loop, without spam! Sign up at www.themorninggrind.com